Monitoring
Administrators can access the monitoring portal, where they can see in real time interactions on the platform, user feedback, and usage statistics presented in user-friendly dashboards.
Logging in for the first time
To log in for the first time, administrators should go to the Monitoring Portal and follow the instructions.
- Select the B2C option.
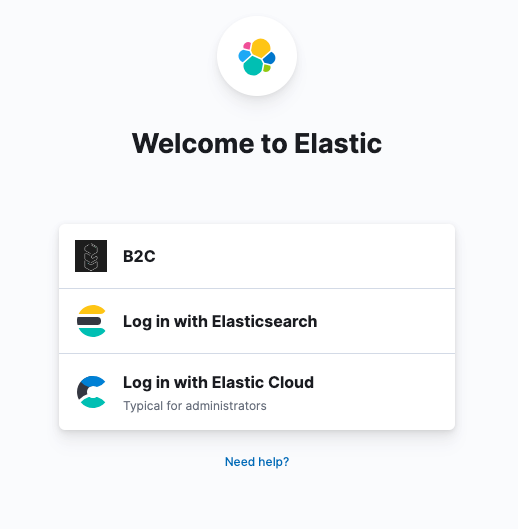
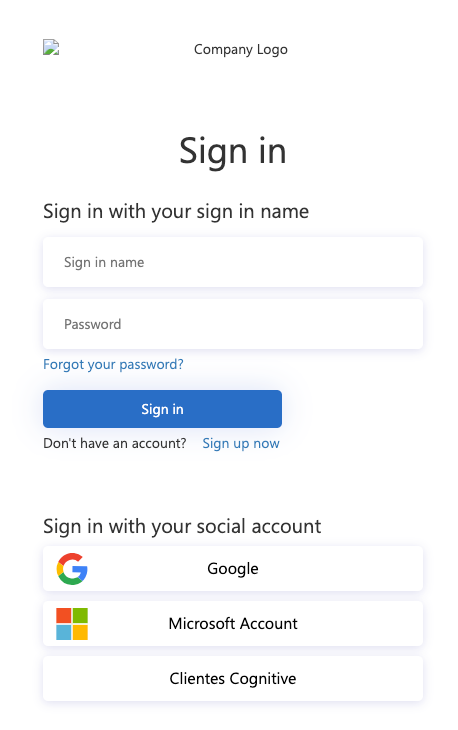
- Select Google if you want to log in with a Google account, select "Sign up now" if you want to register with an email address, or select "Cognitive Customers" if you want to register with a Microsoft O365 work account.
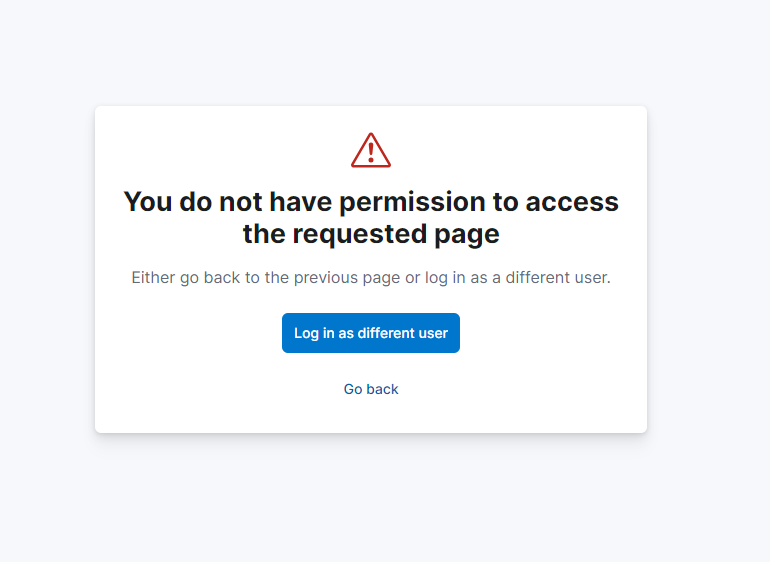
- After logging in, the following message will appear:
-
Notify your contact at Cognitive Solutions to grant permissions to your account.
-
Once Cognitive Solutions has granted the permissions, access again through the administrative portal and follow the login procedure.
Using the Monitoring Portal
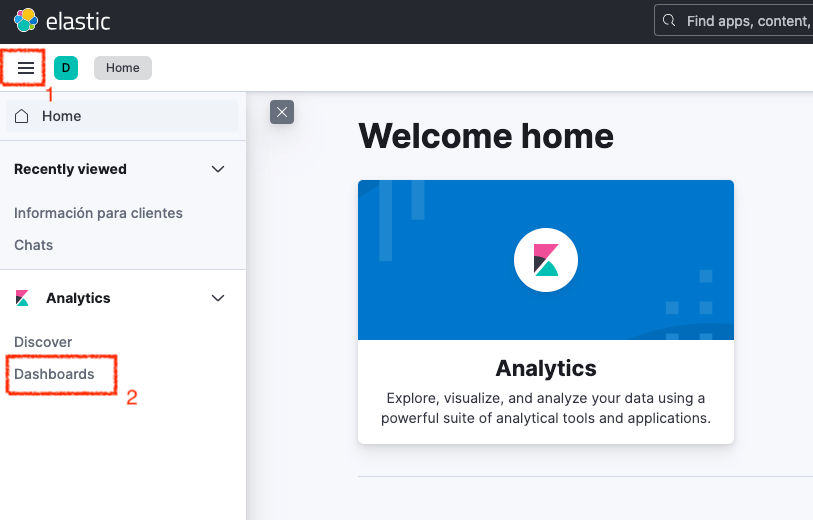
Once you enter the portal, select the menu button in the upper left corner (1), and choose the “Dashboards” option (2).
Select the dashboard indicated by the Cognitive Solutions implementation team.
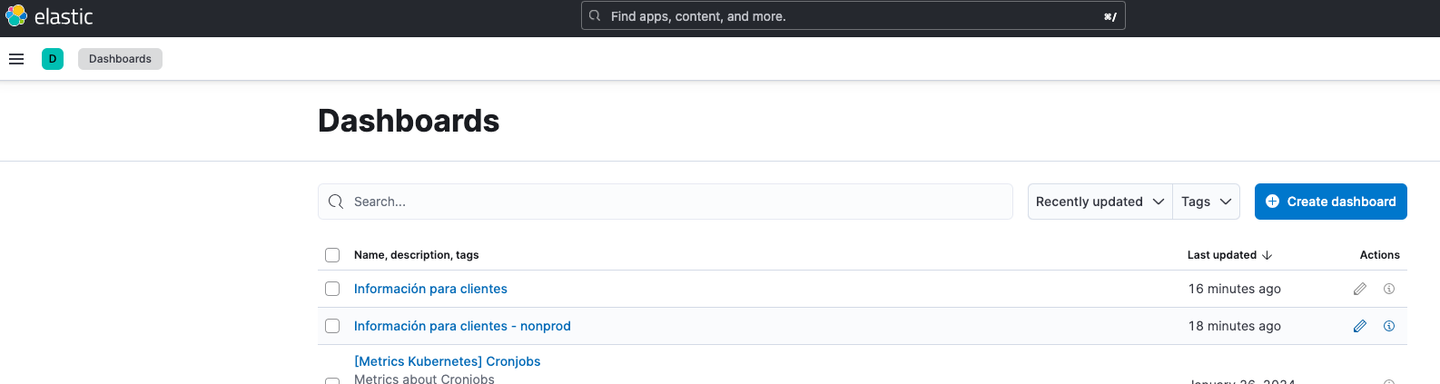
The dashboard looks like this.
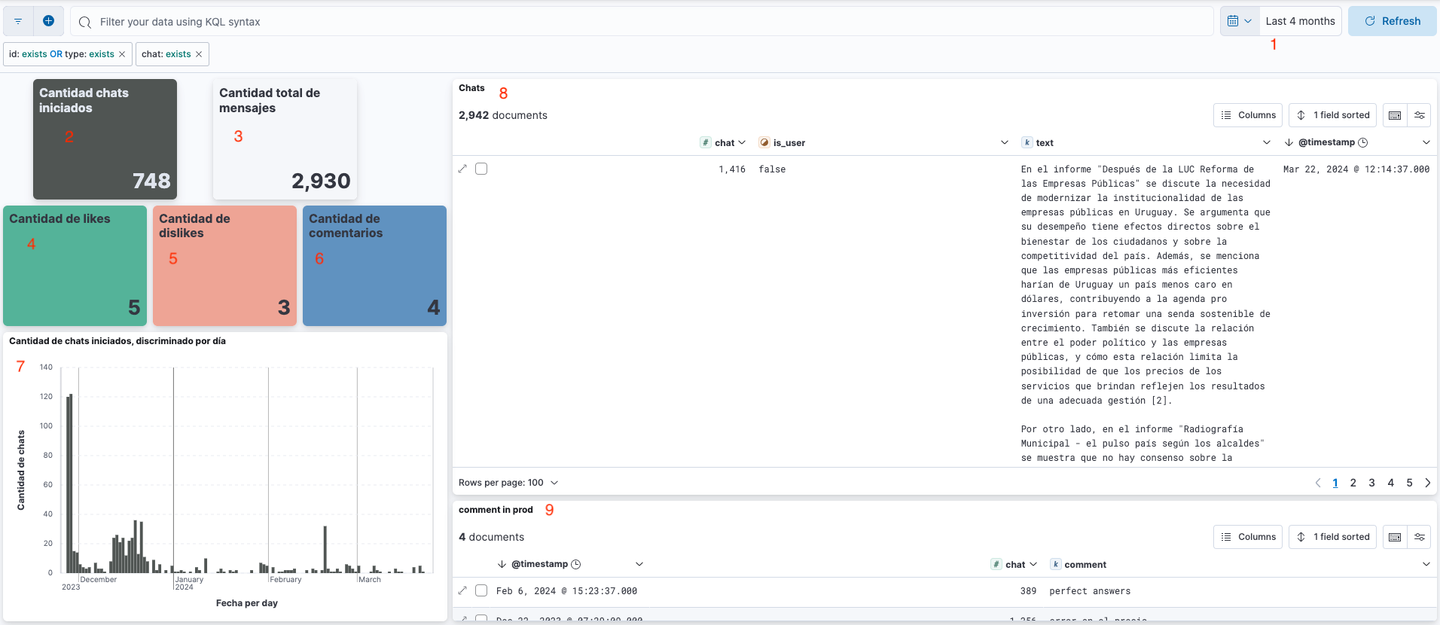
The first thing to do is to select the dates to filter using the date picker in the upper right corner (1). If no dates are selected, data may not be visible.
What you can observe on the dashboard is:
- Number of chats initiated within the date range (2)
- Total number of messages. This includes both assistant and user messages (3)
- Number of chat likes (4)
- Number of chat dislikes (5)
- Number of comments on chats (6)
- Number of chats per day, displayed as a graph (7)
- Visualization of messages (8). For each message, you can see the date, chat ID, user or assistant message indicator (if is_user is false, then it is an assistant message), and the message text.
- Visualization of comments (9). For each comment, you can see the date, chat ID, and the comment text.
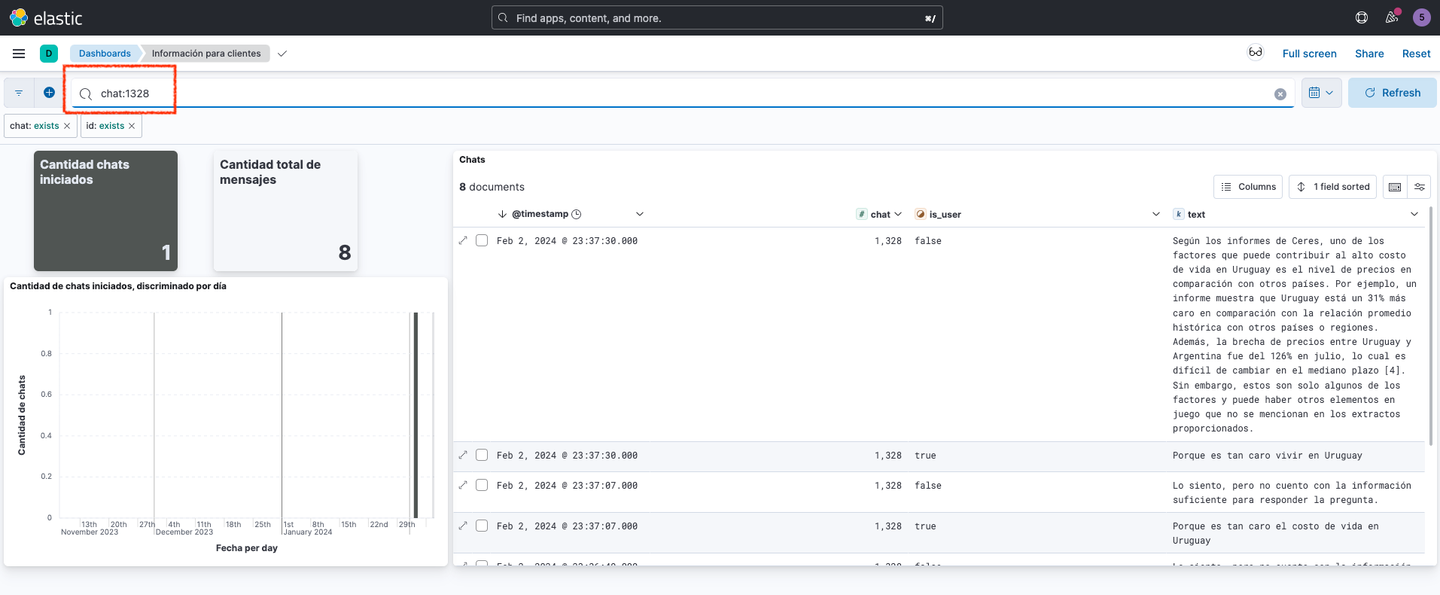
Filters
You can filter by different fields. For example, you can filter by chat to obtain statistics and messages from that chat only. In the example below, we filtered by chat 1328. You can see that this interaction had 8 messages, and you can see the messages in the right panel.